Atmospheric neutrinos
 High energy cosmic rays hitting the atmosphere of the earth produce
a cascade of secondary particles. Among them pions are particularly
numerous. A negative pion decays to a muon and a muon antineutrino, and the
resulting muon decays to an electron, an electron antineutrino, and
a muon neutrino. A positively charged pion produces the charge conjugates
of the respective leptons.
The resulting total neutrino flux can be estimated if the original cosmic ray flux is known. Unfortunately this involves lots of uncertainties, both theoretical and experimental. However, the ratio of muon neutrinos to electron neutrinos can be predicted to be 2, with a good accuracy. On the other hand, muon and electron neutrinos have different spectra that are known a little less accurately.
In water Cerenkov detectors the muon and electron signals can be distinguished by the shape of the ring. In matter electrons lose energy by bremstrahlung (which is proportional to mass to the fourth) which causes minimal changes in their trajectories. Consequently, the Cerenkov cone is varied, so that the rings are less sharp.
Experiments measuring atmospheric neutrino flux
| Experiment | technique | predicted ratio | location | exposure | Years |
|---|---|---|---|---|---|
| IMB | Water Cerenkov | 0.51 ± 0.01 ± 0.05 | Cleveland, Ohio | 7.7 | 1982-1991 |
| Kamiokande | Water Cerenkov | (value) | Kamioka, Japan | 6.1 | 1983-1995 |
| Soudan 2 | Iron calorimeter | (value) | Soudan mine, Minnesota | 5.40 | 1989-1993- |
| Fréjus | Iron calorimeter | 0.56 ± 0.06 | Frejus tunnel, Alps, France | 2.0 | 1984-1988 |
| BUST(Baksan) | Liquid scintillator | Baksan Valley, Caucasus, Russia | 1978- | ||
| Nusex | Calorimeter | 0.54 | Mont Blanc, France | 0.74 | 1982-1988 |
| SuperKamiokande | Water Cerenkov | Kamioka mine, Japan | 70.5 | 1996- | |
| MACRO | Gran Sasso, Italy | 1991-2000 | |||
| ICARUS | Gran Sasso, Italy | 200?- |
Experimental results
| Experiment | measured ratio | ratio of ratios | mu ratio | Contained/ Sub GeV | Uncontained/ Multi GeV |
|---|---|---|---|---|---|
| IMB | 0.36 ± 0.02 ± 0.02 | 0.54 ± 0.05 ± 0.07 | 1.03 ± 0.04 | ||
| Kamiokande | 0.60 ± 0.06 | 0.94 ± 0.06 | 0.60 ± 0.06 ± 0.05 | 0.57 ± 0.08 ± 0.07 | |
| Soudan 2 | 0.68 ± 0.11 ± 0.06 | ||||
| Fréjus | 0.53 ± 0.15 | 0.99 ± 0.13 ± 0.08 | 0.87 ± 0.15 | ||
| BUST(Baksan) | 0.85 ± 0.03 ± 0.05 | 1.13 | |||
| Nusex | 0.52 ± 0.17 | 1.0 ± 0.3 | 0.87 ± 0.15 | ||
| SuperKamiokande | (value) | 0.658 ± 0.016 ± 0.035 | 0.702 +0.032-0.030 ± 0.101 | ||
| MACRO | 0.73 ± 0.05 ± 0.12 |
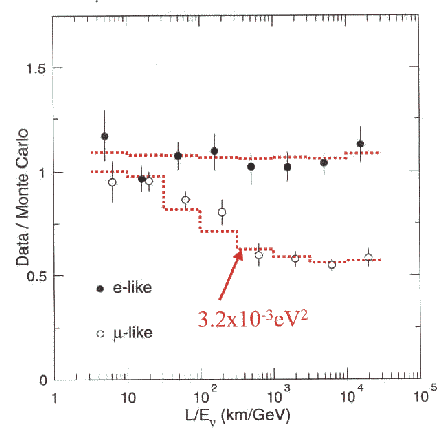
L/E plot of SuperKamiokande:

Explanation of the data
The ratio refers to the ratio of electron-like (non-showering) events to
muon-like (showering) events.
Ratio of ratios is the ratio of the observed ratio to the
predicted ratio.
Exposure is measured in kiloton years.
In some cases the results, esp. the double ratios differ from the
values quoted elsewhere. This may be due to different
theoretical fluxes used. I do not claim that the values
given here are better than values quoted in other reviews.
Note that the results do not always correspond to
the same kind of measurement, they differ by several parameters
like energy and direction.
Theoretical explanations
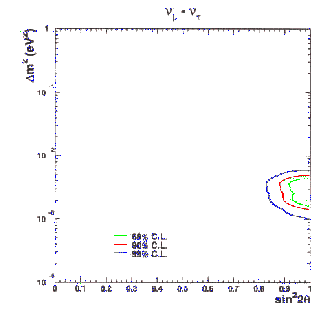
The data is consistent with neutrino oscillation from muon neutrinos to tau neutrinos. Oscillation to electron neutrinos do not fit the Superkamiokande data. Oscillation to sterile neutrinos is disfavored, at least in 2 sigma level.The favored values (SK) for the oscillation parameters are
m2 ~ 1.5 10-3 ... 5 10-3
sin2 > 0.88
Plots
A two flavor fit to SuperKamiokande data, presented by Sobel at Neutrino 2000
Other plots:
- SK three flavor fit, a transparency shown by Sobel in Neutrino 2000.
Back to mainpage